The debate between Tableau and Excel is a popular one in the data science community. It is true that for prospective data scientists, Excel is not a top resume-building ability. However, it has been around for a very long time, and you probably already know a tonne of valuable Excel strategies for cleaning and analysing data.
Since Tableau and Excel are both used for data analysis, most people feel the need to compare the two programmes. However, each tool has a unique set of benefits and qualities that make it irreplaceable.
What is Excel?
Everyone is familiar with Excel. Even if you don’t spend your days deep in spreadsheet analysis, you are aware of what Excel can achieve and you are aware of the fundamentals of how to view it.
Let’s look at a few pros and cons of utilising Excel for data analysis.
Pros
- It’s a trusted tool
- It doesn’t have a learning curve
- It’s easy to create data collection tools
- It has templates and formulas for data analysis and reports
- It’s simple to create charts and graphs
Cons
- It’s hard to consolidate reports
- It’s incapable of supporting quick decision-making
- It’s not designed for collaborative work
- Lack of control and security
- It’s vulnerable to fraud/corruption
- It’s difficult to troubleshoot or test
Want to learn how you can use Excel for your data analysis and data visualisation? Check out our beginner-friendly data analytics series which consists of two courses.
- Problem Solving with Data Analytics For Beginners
- Data Visualisation & Data Storytelling For Beginners
What is Tableau?
Tableau is the fastest-growing platform for data visualisation, supporting you in transforming textual and numerical data into stunning interactive dashboards. It is the most effective approach to modify or transform the raw data into data that is simple to grasp.
Tableau has a tremendous following in the business and public sectors since it is so well-liked, interactive, easy to use, and instant. The wonderful thing about Tableau is that it doesn’t require any technical or programming knowledge to use. People from a variety of fields, including business, research, and diverse industries, have developed an interest in it.
You can learn more about Tableau from our previous post – What is Tableau & Why is it Popular?
Now, let’s explore some of the pros and cons of utilising Tableau for data analysis.
Pros
- Interactive visualisations
- It’s easy to implement
- It’s able to handle large amounts of data
- It’s able to understand other scripting languages
- It’s mobile-friendly
- Its parameters are static
- It has limited data preprocessing
- It’s able to integrate with most data types and a variety of big data platforms
- It supports collaboration and real-time analysis
Cons
- It does not have a scheduling function for reports
- It does not support custom visual imports
- Poor versioning
- It requires manual effort
Ready to learn how you can use Tableau to build stunning visualisations and interactive reports? Sign up for our highly-reviewed & beginner-friendly Tableau course – Data Visualisation Using Tableau For Beginners.
Excel vs. Tableau: The Comparison

#1 Purpose
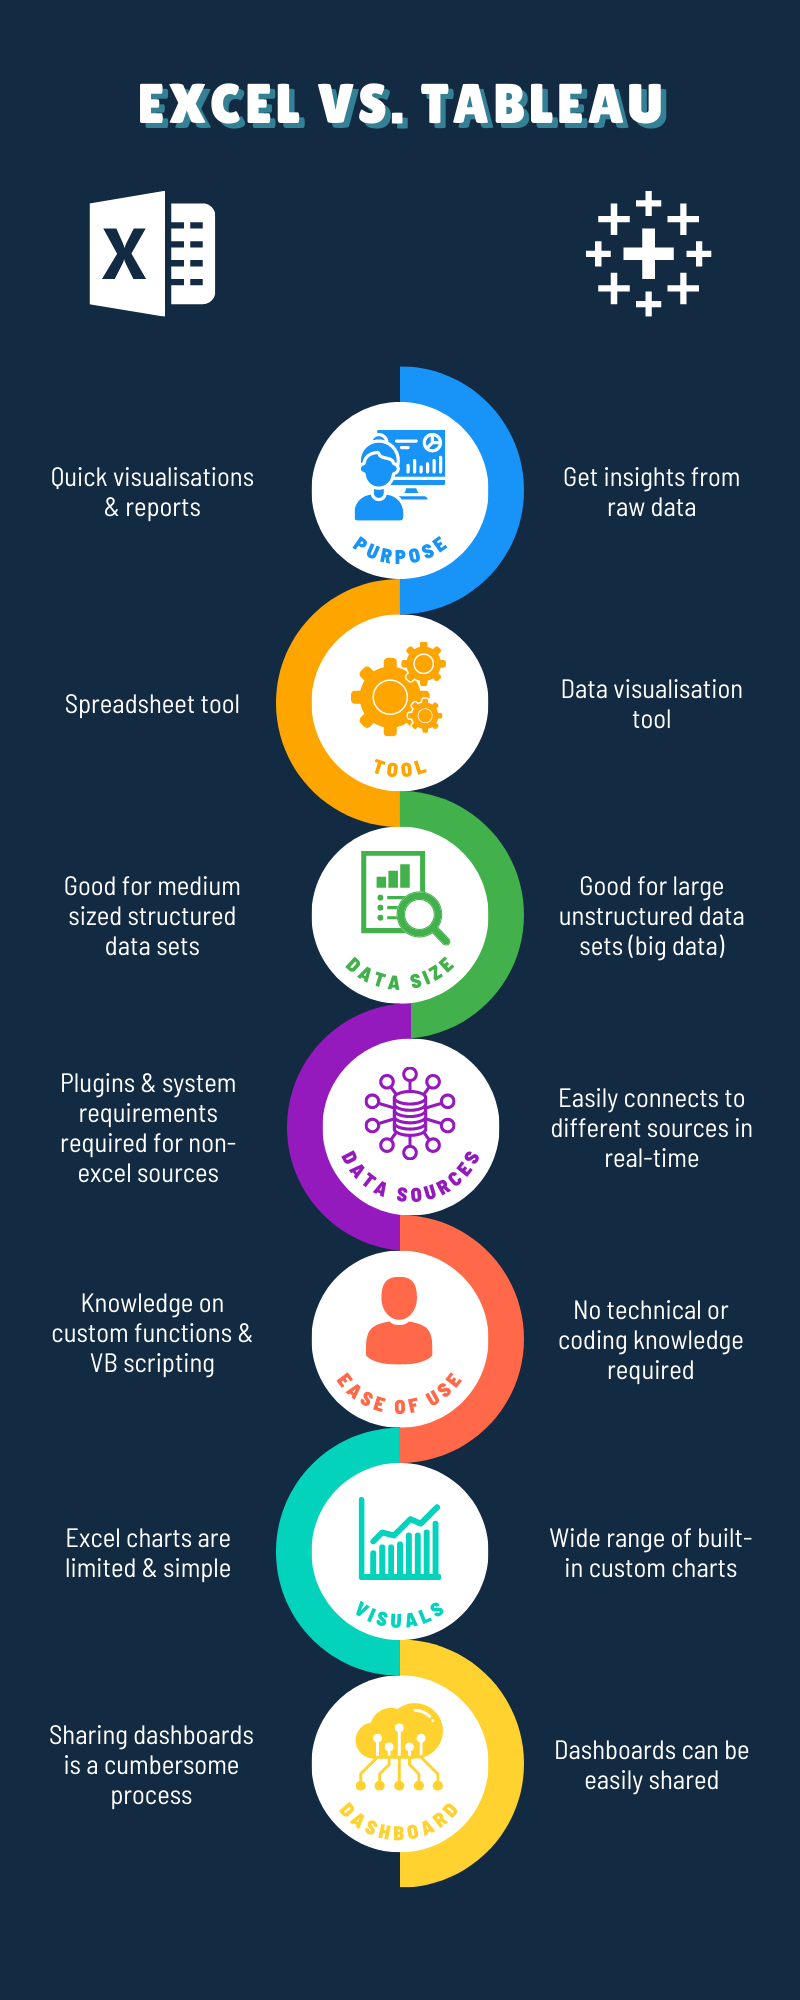
Excel is able to generate quick visualisations and reports whereas Tableau is able to draw insights from raw data.
Finding important insights in the data is what allows businesses to stay competitive in their marketplaces, and this is where the two tools differ dramatically.
When using Excel, you must already have a plan for where the data should take you in order to gain important insights. Since the data is saved in a tabular format, planning out your solution, creating formulas and visualisations, and analysing the data are all necessary steps on the way to insight. As a result, it becomes more difficult to analyse data at a granular level and the process of drilling down into data becomes less flexible.
Tableau, on the other hand, enables you to freely examine data without predetermining the solution you seek. You can identify correlations and patterns and then delve further to discover what caused them, rather than the other way around, thanks to built-in drill-down and data blending features.
#2 Tool
Excel is a spreadsheet tool whereas Tableau is a data visualisation tool.
Electronic worksheets known as “spreadsheet tools” show data in a tabular style (a table of columns and rows). Every data point is kept in a “cell” and can be changed by manually created formulas. To highlight a certain discovery, graphs, charts, or presentations can be made later.
In contrast, data visualisation tools arrange data in a pictorial or graphical way to make it simple to see patterns, trends, or connections between data points. With user-friendly functionality like drag-and-drop capabilities and drop-down menus, these applications often connect to third-party tools to pull data and allow users to freely explore the data.
#3 Data Size
Excel is good for medium-sized, structured data sets whereas Tableau is good for large, unstructured data sets (big data).
For SMEs or organisations with modest or medium-sized data volumes, Excel is the ideal option. It works well with structured data. Structured data is made up of many data kinds that can be divided into three groups: character-based, date- or time-based, and numeric data types.
On the other side, Tableau is a fantastic tool for gaining insights from the big data problems being depicted. All sizes of organisations can benefit from it, and it works well with unstructured data. As the name implies, there is no structure at all in this form of data. Unstructured data inherently has far higher data requirements than structured data. It is not possible to automatically store unstructured data in rows and columns, and significant processing would be required to give it some kind of form. This processing is dynamic and rather complex in and of itself. For instance, reviews on a website would all be written in a different tone and style, making it difficult for an algorithm to understand them.
#4 Data Sources
Excel requires external plugins and system requirements when dealing with non-excel data sources whereas Tableau easily connects with different sources in real-time.
Excel provides users with integration capabilities. However, without the aid of specific plugins or certain system requirements, you are unable to connect with non-Excel data sources. Tableau, on the other hand, can link to a variety of sources.
#5 Ease of Use
For Excel, you will need knowledge of custom functions and scripting (VBA) whereas no technical or coding knowledge is required for Tableau.
Excel is a simple programme to use since it has a spreadsheet feature that makes it simple for beginners to enter data and carry out some simple mathematical operations.
But you must be familiar with visual basic (VB) scripting if you want to use Excel to its full potential. To use macros fully, you should be knowledgeable about them as well.
Tableau, on the other side, provides the best graphical user interface. It offers drag-and-drop capabilities. This implies that you are not required to have coding expertise in order to use Tableau.
#6 Visuals
Excel charts are limited and simple whereas Tableau offers a wide range of built-in custom charts.
The method of highlighting the most important facts in a particular data collection is known as “visualisation,” and it is the main difference between Excel and Tableau in this comparison.
You can change the data at the cell level with Excel. then manually produce visual representations of your data, such as graphs, charts, and PowerPoint presentations. However, you must have a thorough understanding of Excel’s features in order to make the construction of visualisations in Excel simpler.
Tableau, on the other hand, is one of the most widely used data visualisation tools worldwide. Because the data is visualised right away, you can immediately see its significance.
Additionally, Tableau distinguishes associations using colour, size, labels, and forms. This gives you context as you dive deeper into the data.
#7 Dashboard
Creating and sharing dashboards in Excel is a cumbersome process whereas, in Tableau, dashboards can be easily created and shared.
To share dashboards and files on Excel, all the users will have to align their Excel versions with one another. Once that is done, users have to insert the shared workbook on a network location where other users can gain access to it.
Tableau, on the other hand, was designed with teamwork in mind. Team members are able to distribute data, conduct follow-up inquiries, and send dashboards to anyone who could benefit from the data. Data collaboration is simple with Tableau and users can even work on dashboards in real time.
Excel vs. Tableau: Which Tool Is Better?
In this blog, we’ve seen how Excel and Tableau are both utilised for similar things (data analysis, manipulation, visualisation and generation of reports). However, the difference rests in whether business users or technical users use both tools.
Deciding which tool is best for your company depends on three main points:
- The types of reports your business needs
- How often you’re building those reports
- Your budget for the data analytics tool
Excel is a great tool for quickly producing one-off reports. Although it used to be a static tool, Excel has greatly upgraded its features throughout the years.
Users can now make periodic reports, better analyse data, and gather information from various sources. The application is also easily accessible with Microsoft Office.
Excel is a reliable tool, but it requires some sophisticated knowledge of its capabilities to create and maintain recurring reports, make visuals and presentations, and drill down into granular views of data.
Tableau was designed with the business executive in mind. Decision-makers can access reports or dashboards and readily drill down to detailed levels of information because of its data visualisation and self-service features. The solution can be pricey, but if you frequently create recurring reports that need to be updated, it’s worth the money.
The bottom line: When performing several calculations and data manipulations, use Excel. Use Tableau when you need to gather all the data in one location and present it on the dashboard with effective visuals. Both can be used in tandem, with the final data set being imported to Tableau for additional processing once all the key computations have been completed on Excel.

