
In the corporate jungle you are expected to know how to use Microsoft Excel. But, let’s be honest here: how well verse are you in using Microsoft Excel?
Many of us think that, “Well, I know how to input numbers into Excel and I know how to use sum up and average formula”. If that is what you are mainly doing with Microsoft Excel, there is a lot mooorrreeee functions to discover and learn from the almighty software by Microsoft.
These are the tasks that you can achieve just using Microsoft Excel but not limited to (no fancy and expensive software required!)
- Identifying data trends using graphs or charts
- Record expenditures and income, plan budgets, chart data and succinctly present fiscal results
- Prepare visually stunning presentation and report using dashboard report function
- Managing large database to quickly summarize large amounts of data into a meaningful report using PivotTables function
- Develop relatively sophisticated financial and scientific computation capabilities using Excel VBA programming
Understanding Cell, Rows, Columns, Worksheet and Workbook
Before we get started with the functions of MS Excel, it is important that you understand what cell, row, column, worksheet and workbook is. Let’s see the illustration below to help you understand more:
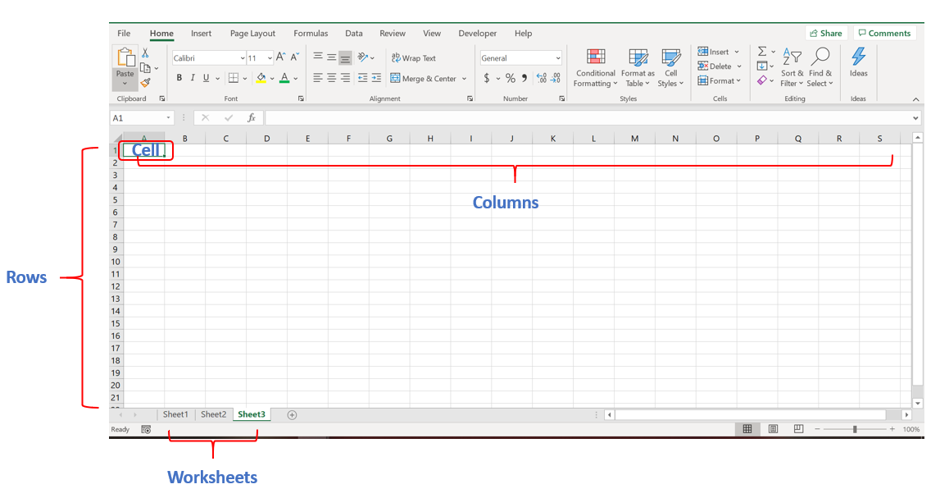
The point where a column and a row meet is called a cell. Cells are used to record data. Each cell is uniquely identified using a cell address (E.g. A1 is the cell address pointed in the image above). Columns are usually labelled with letters while rows are usually numbers. A worksheet is a collection of rows and columns. A workbook is a collection of worksheets.
Now, let’s get started with these 3 Microsoft Excel basic tips and tricks for your hands-on learning (See advanced skills of MS Excel if you are familiar with the basic functions):
1. Excel Formulas
Excel can help you do simple arithmetic like adding, subtracting, multiplying, or dividing any of your data.
- To add, use the + sign.
- To subtract, use the – sign.
- To multiply, use the * sign.
- To divide, use the / sign.
- To use exponents, use the ^ sign.
Remember, all formulas in Excel must begin with an equal sign (=). Use parentheses to ensure certain calculations are done first. For example, consider how =10+10*10 is different than =(10+10)*10.
In the illustration below, we calculate the BMI using the formula =(weight (kg) / height (cm)/ height (cm)) x 10,000

In addition to manually typing in simple calculations, you can refer to Excel’s built-in formulas. Some of the most common include:
Average: =AVERAGE(cell range)
Sum: =SUM(cell range)
Count: =COUNT(cell range)
Also note that series of specific cells are separated by a comma (,), while cell ranges are notated with a colon (:). For example, you could have =SUM(D2,D3,D4,D5,D6) or =SUM(D2:D6).
2. Autofill/ Flash Fill
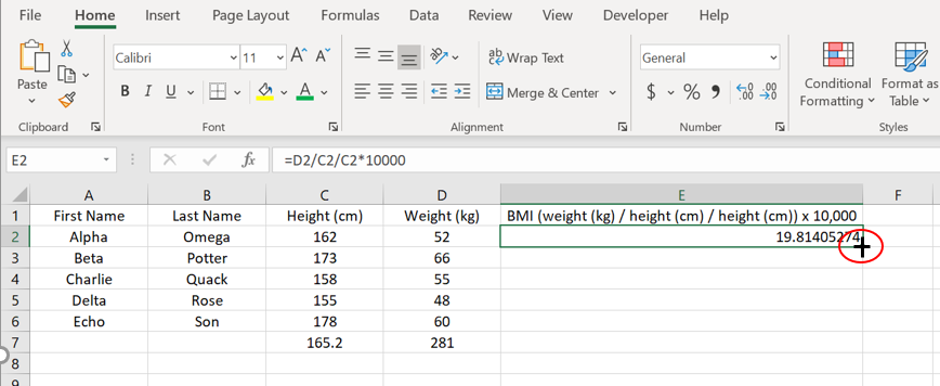
Autofill allows you to quickly fill adjacent cells with several types of data, including values, series, and formulas. There are multiple ways to use this feature, but the fill handle (it looks like a plus sign when you hover your mouse to the lower-right corner of the cell) is among the easiest. Select the cells you want to be the source, you can either drag the fill handle to cover cells you want to fill or just double click.
3. Sort & Filter
When you’re looking at very large data sets (as you often do), you don’t usually need to be looking at every single row at the same time. Sometimes, you only want to look at data that fit into certain criteria. That’s where filters come in.
Sort and Filters allow you to pare down your data to only look at certain rows at one time. In Excel, a filter can be added to each column in your data. From there, you can then choose which cells you want to view at once or sort your data list by alphabetical/ reverse alphabetical/ ascending/ descending order.

First, add a filter by clicking the Data tab and selecting “Filter.” The arrows will appear in your data header and you will be able to just see particular rows that you want to show.
In the example, we only want to show data that has the weight of 48. Click on the arrow button on the weight column and select 48 to show. You can cancel the filter by clicking the arrow button of the weight and click on “Clear Filter”.

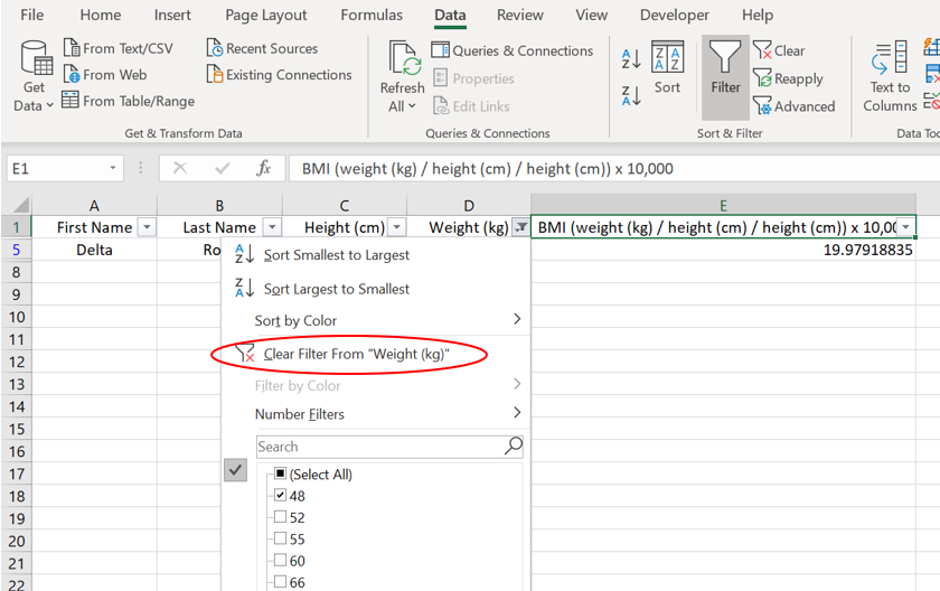
You will also be able to sort the data by smallest to highest number. In the example below, we sort by the lowest BMI to highest BMI. Click on the arrow on BMI column and click on “Sort Smallest to Largest”
Learn More about Microsoft Excel at Aventis
Microsoft Excel is an incredibly powerful tool, no matter which function your job scope is. In our series of Microsoft Excel workshop, you’ll find a number of useful features that will help to increase your productivity in your day-to-day administration tasks. And don’t worry: the workshop will be facilitated in a step-by-step approach.
- Microsoft Excel Tips & Tricks for Beginners
- Mastering Microsoft Excel Intermediate Level Features & Skills
- Advanced Microsoft Excel Skills For Business Analysis and Reporting
Bonus: Useful Excel Shortcuts
| Ctrl + ArrowUp | Go back to the first row |
| Ctrl + ArrowDown | Go to the last row |
| Ctrl + ArrowLeft | Go to the first column |
| Ctrl + ArrowRight | Go to the last column |
| Ctrl + Shift + ArrowDown | Highlight current cell to the last cell |
| Ctrl + PageDown | View the next worksheet |
| Ctrl + PageUp | View the previous worksheet |
| Ctrl + Tab | Switch amongst all the other opened workbook |
| Alt + Enter | Go to the next line in a cell (similar as enter function in word document. Only works when you are editing a cell) |