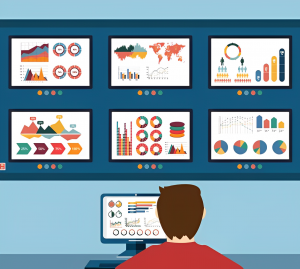
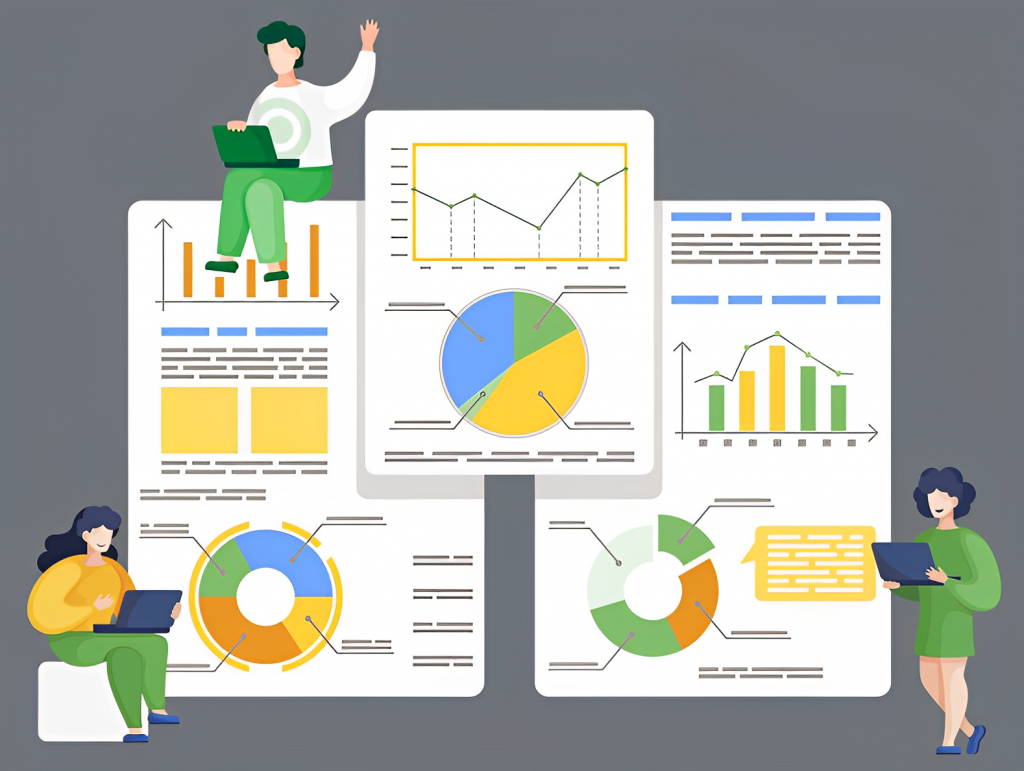
 In today’s data-driven business landscape, the ability to efficiently analyze and present data is paramount. Microsoft Excel, a staple tool in the world of spreadsheets, offers a powerful feature that can revolutionize the way you interact with your data – Excel Dashboard Reporting. This feature enables you to create dynamic, visually appealing dashboards that consolidate complex data sets into insightful visual representations. In this blog, we’ll explore the benefits of Excel Dashboard Reporting and provide you with three effective ways to enhance your dashboard creation skills.
Benefits of Excel Dashboard Reporting:
1. Enhanced Data Visualization: Excel Dashboard Reporting allows you to transform raw data into interactive visual elements such as charts, graphs, and KPI meters. This level of visual representation helps you grasp trends, patterns, and correlations that might otherwise go unnoticed in a spreadsheet filled with numbers. By presenting data in a visually appealing manner, you can quickly communicate key insights to stakeholders, facilitating better decision-making processes.
2. Real-time Monitoring: Dashboards created in Excel can be linked to live data sources, ensuring that the information displayed is always up-to-date. This real-time monitoring capability is particularly useful for tracking metrics and performance indicators that change frequently. With automatic data refreshes, you can stay informed without the need to manually update your dashboard, saving valuable time and ensuring accuracy.
3. Customizable Insights: One of the standout features of Excel Dashboard Reporting is its flexibility in customization. You have the power to tailor your dashboards to suit your audience’s needs, adjusting colors, fonts, and layouts to match your organization’s branding or personal preferences. This customization extends to the choice of visualization types, allowing you to select the most effective chart or graph style for your data, ensuring that your insights are communicated clearly and effectively.
Ways to Make Improvements:
1. Data Source Optimization:
To create impactful dashboards, start by ensuring that your data sources are well-organized and up-to-date. Invest time in cleaning and structuring your data before importing it into Excel. This will not only improve the accuracy of your insights but also streamline the dashboard creation process. Consider using Excel’s built-in data transformation tools or external data cleaning software to ensure your data is primed for visualization.
2. Choose the Right Visualizations:
Selecting the appropriate visualization type is crucial for conveying insights accurately. Understand the different chart and graph options available in Excel and choose the ones that best represent your data’s story. Line charts for trends over time, pie charts for part-to-whole relationships, and bar graphs for comparisons are just a few examples. Experiment with different visualizations to find the most effective way to communicate your data’s narrative.
3. Implement Interactivity:
Take advantage of Excel’s interactive features to engage your audience and encourage deeper exploration. Utilize slicers, filters, and dropdown lists to allow users to dynamically change the data displayed on the dashboard. This interactivity empowers users to focus on specific aspects of the data that matter most to them, enhancing their understanding and interaction with the insights you’ve presented.
Excel Dashboard Reporting is a game-changing tool for transforming data into meaningful insights. Its ability to enhance data visualization, enable real-time monitoring, and offer customization options makes it an indispensable asset for businesses and professionals alike. By optimizing your data sources, choosing the right visualizations, and implementing interactivity, you can take your Excel dashboards to the next level, driving better decision-making and fostering a deeper understanding of your data. Elevate your reporting game with Excel Dashboard Reporting and unlock the true potential of your data-driven journey.
Elevate Your Excel Expertise: Master Data Modeling and Visualization!
In today’s data-driven world, the key to unlocking insights lies in powerful dashboards. Imagine having a one-page report at your fingertips, capable of instantly addressing vital questions. Which regions are outperforming the rest? What products should take center stage? Welcome to the world of dashboards – where information becomes intelligence.
Dashboards come alive, whether as dynamic canvases or interactive hubs, where data responds to your every command. Picture this: tracking KPIs seamlessly, comparing data points effortlessly, and gaining data-backed perspectives that steer managerial decisions. This is the magic of an Excel Dashboard.
Are you tired of grappling with manual data extraction from countless sources? Have you ever envisioned transforming raw data into actionable insights using Excel? Are you ready to wield Excel’s prowess for dynamic, captivating reports that breathe life into data?
If these questions resonate, look no further. Our course is your compass, guiding you through the art of crafting dynamic dashboards from scratch. Unveil the potential of Microsoft Excel’s tools and functions to craft captivating visual narratives that drive informed decisions. Step into the realm of possibilities – enroll today and illuminate your data journey!

Seats are limited, so secure your spot promptly! Click here to discover more and embark on an exciting journey into the dashboard reporting.


