

Whether we are conscious of it or not, we are constantly flooded with visual information. The world around us communicates a steady stream of information and frequently does so with some kind of visual representation to facilitate its speedy assimilation, from print advertisements and television commercials to stop signs and green lights.
In the era of instantaneous data gratification, how can businesses and organisations interact with their staff, clients, and stakeholders? The answer is straightforward: storytelling with data, also known as data storytelling.
Data is displayed in spreadsheets and static reports, but narrative data visualisations provide context. In other words, the information in spreadsheets and dashboards simply describes the current situation. However, they don’t explain why. The two have a little but significant difference.
Data storytelling provides the context your audience requires to identify the connections between major trends. It engages consumers and enables them to convert unprocessed data into actionable knowledge. This cannot be achieved by merely showing people numbers.
Data storytelling appeals to and is accessible to a wide audience, including individuals who aren’t as data-savvy as the professionals behind the reports. The best part is that anyone can use data-driven storytelling to improve their organisation; all you need are the appropriate tools and a road map to get going.
How Does Data Storytelling Work?
Data storytelling doesn’t need you to throw away everything you have and start from scratch. You also don’t need to configure anything for days or months. It’s the quickest method to get everyone in your business focused on the right things and to make decisions more quickly and effectively than before.
To complement your data exploration and analytics efforts, bringing data comprehension and action to everyone in your organisation is more akin to a cultural revolution. It’s the individualised, hassle-free experience that you have grown accustomed to in the modern world. Your staff can now truly become data-driven in new ways.
So what happens in your company when you start using storytelling with data? Let’s go over each step in turn.
Here are some ways that data storytelling can benefit your organisation and yourself.
Instantly understand your data with stories instead of dashboards
Instead of making your staff analyse spreadsheets or investigate dashboards, what happens when you provide them a means to quickly comprehend the data that matters to them?
For the majority of businesses, it means developing a fundamentally open, data-driven culture, making better decisions, and achieving and exceeding goals more quickly. You can use data-driven storytelling to quickly enable your employees to comprehend the business or make a choice. However, things need not stop there. If they like, they may initiate the dialogue with other team members.
Every single one of your employees cannot have a personal analyst creating reports for them. Because of this, there are various platforms and solutions for business intelligence and data visualisation that can help your company use data storytelling.
Learn what you need to know to make smarter decisions
The typical approach to understanding data takes anywhere from minutes to days. Employees are poring over long spreadsheets, digging through dashboards, or simply asking their operations or analysis teams a million questions and waiting hours for a response.
Understanding data typically takes anywhere from minutes to days. Employees are spending hours looking over lengthy spreadsheets, exploring dashboards, or just contacting their operations or analytic teams with a gazillion inquiries before receiving an answer.
Your staff may read a personalised story that is automatically customised to their needs and informs them all they need to know about your company via data storytelling. Intelligent data storytelling technology exists which means that it naturally conveys to each employee the most essential and fascinating information.
Start the conversation with your team about how to take action
The only way to guarantee that everyone genuinely comprehends facts is through stories. Storytelling with data guarantees that key information is surfaced to your employees where they are already, rather than requiring them to search for answers.
Data storytelling allows for features like commenting and discussion, interfaces with other communication tools like Slack, and robust sharing capabilities via email.
What Makes A Good Data Story?

A good data story leverages three key components: Visualisation, Narrative, and Context.
1) Visualisation
No data visualisation can be used universally. It’s crucial to select visuals that accurately reflect the goal of each data set. For instance, a pie graph is substantially less useful than a bar graph when comparing two measures.
However, more and more “non-technical” people are growing accustomed to making data visualisations as a result of the rise of self-service analytics systems being implemented in a variety of industries.
2) Narrative
The narrative component sets data stories apart from other popular formats for presenting complex information in a comprehensible way, such as infographics. Placing your story on a timeline makes it simple to construct a narrative. Through a succession of visuals, data stories must investigate and attempt to explain how and why data changes over time.
Data stories also have a beginning and a middle, just like any other story. Giving your audience a forward trajectory will enable them to process each data item more quickly in the context of the previous one. This narrative structure can help in the gradual disclosure of data insights as well as underlying patterns and trends.
However, data stories shouldn’t have a predetermined ending like conventional narratives do. Keep in mind the objective of data storytelling. You want your viewers to take some sort of action. Your story should conclude with a series of options or questions to achieve this.
3) Context
In order to avoid misunderstandings or misinterpretation of your message, context is essential. Every data story starts with a problem or challenge, so your story already has context. But sometimes this isn’t enough. Each piece of information should complement or contrast the one before it as well as the link to it. Your story will probably include data points related to time, place, trend, relevance, percentage, etc. Each of these should be acknowledged as such because they each contribute to the context of your story.
Examples and Case Studies
Here are some examples of how companies like Spotify, Slack and Uber have all used the power of data storytelling to communicate with their consumers.
Spotify
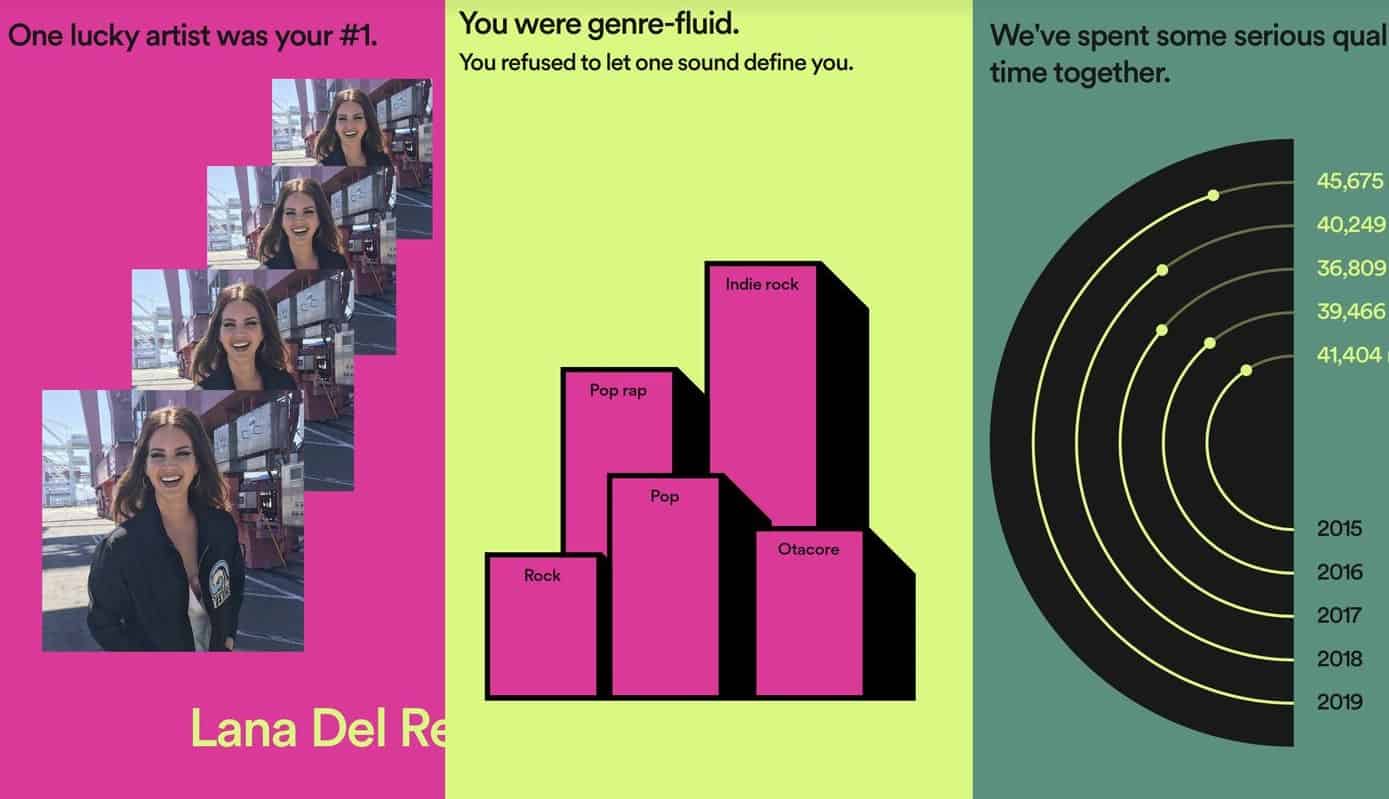
If you’re not familiar, Spotify is a Swedish company that offers media streaming and other services. It has more than 300 million users worldwide since its 2008 launch. Spotify has started sending “<year> Wrapped” annual recap stories to its users in previous years. For each user, these short stories extract informative facts like:
- The genres a user has listened to
- The amount of time a user has spent on Spotify compared with to previous years
- Most streamed songs
The list goes on, but this is a more interesting method of conveying the value of their service than just sending an invoice or a straightforward “thanks for using us”
Slack
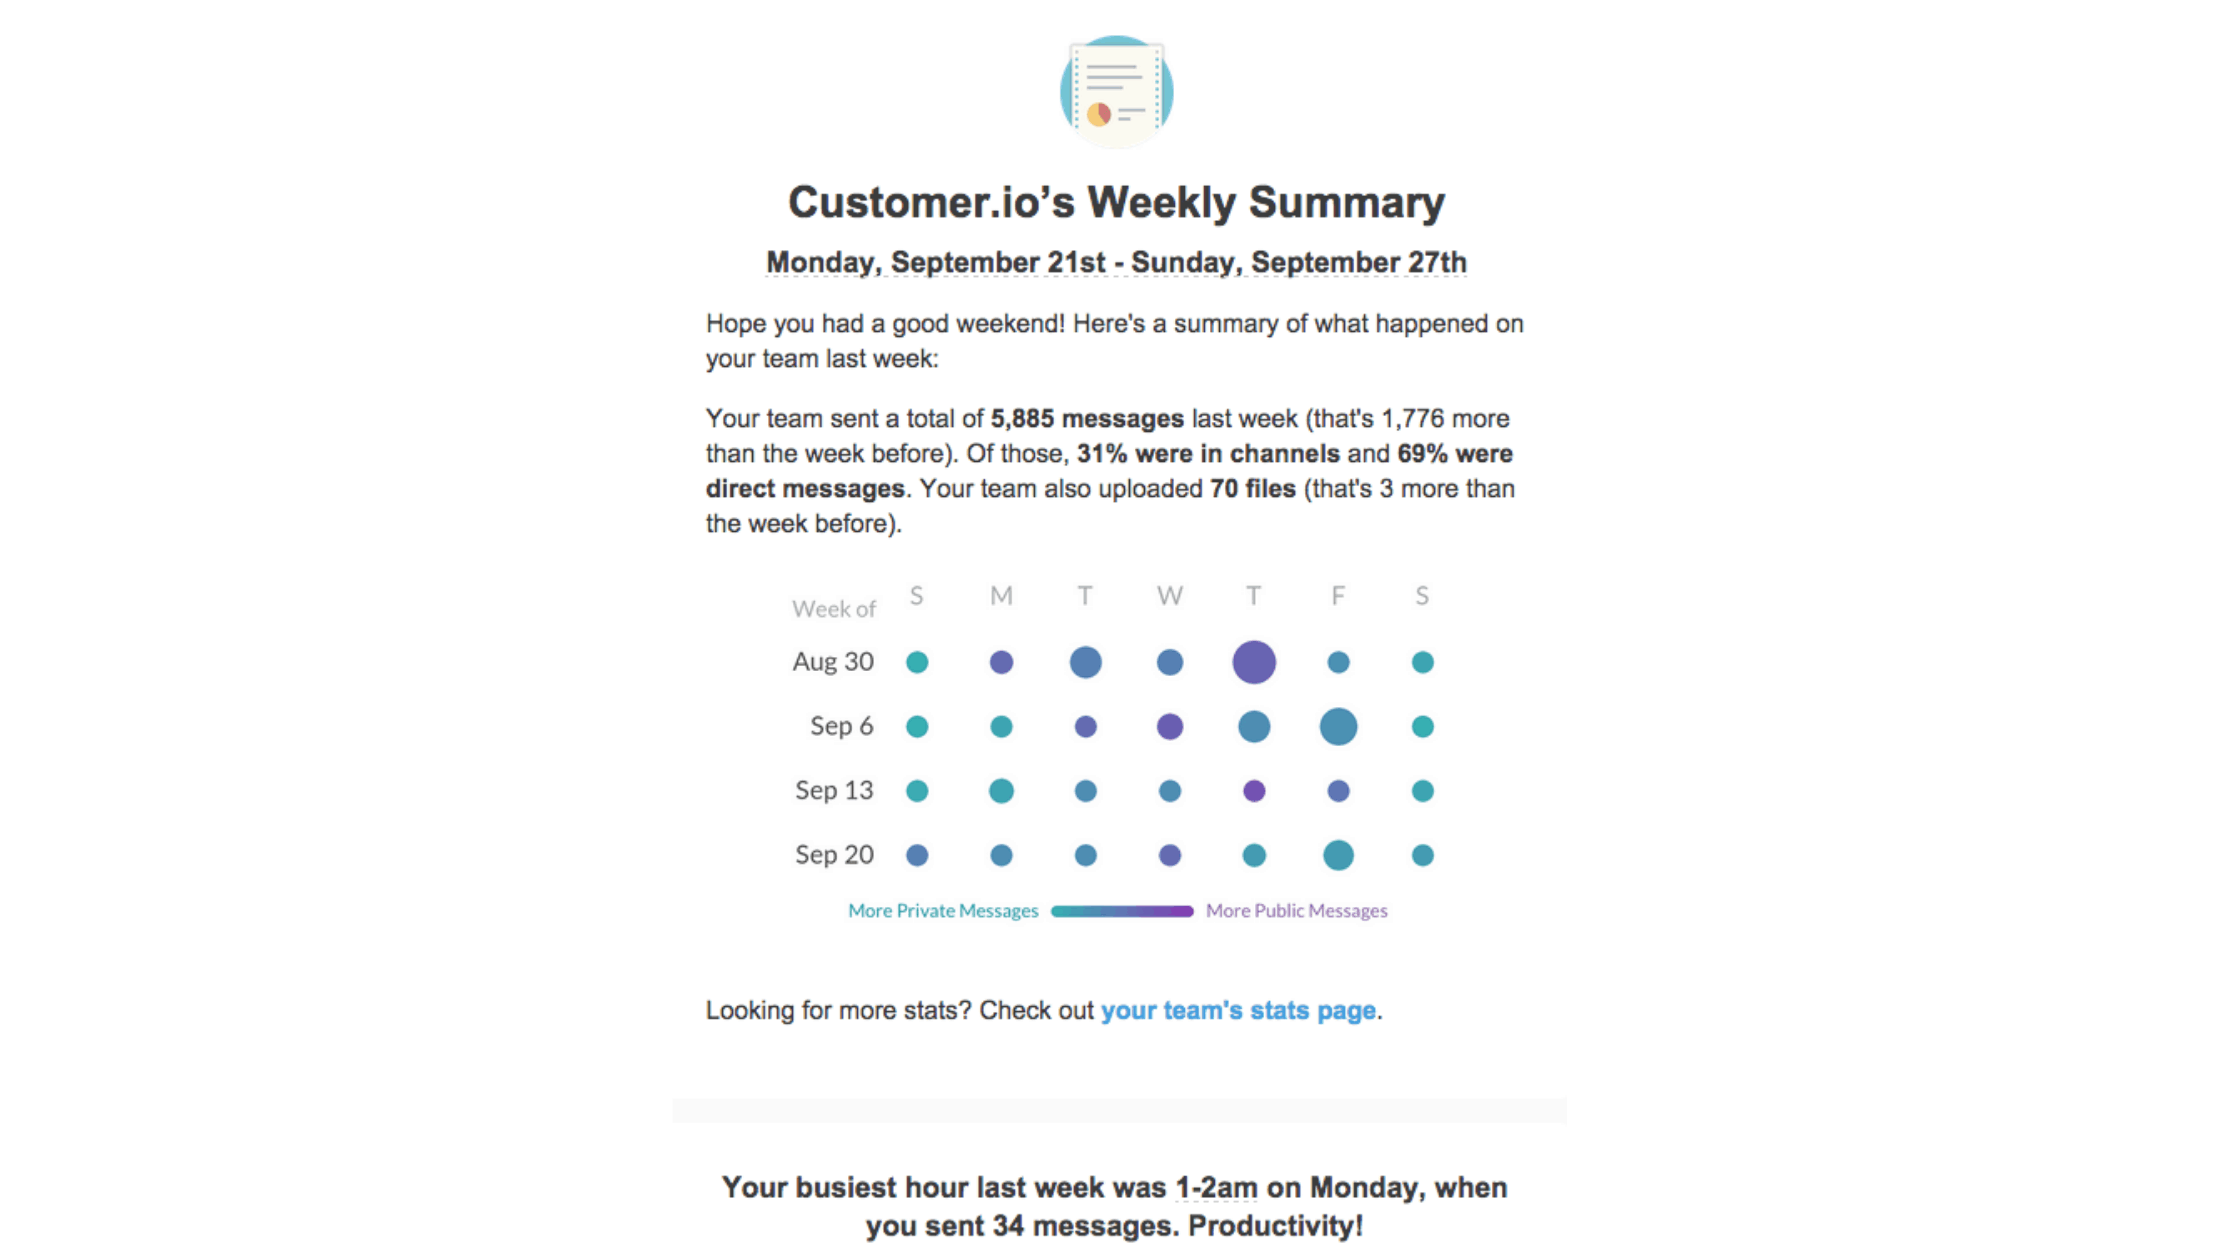
Slack is a platform for business communication that offers Internet-Relay Chat (IRC)-style functionalities, such as private groups, direct messaging, and topic-organized persistent chat rooms (channels). Each month, around the time of billing, Slack employs data storytelling to engage clients in a new conversation. Slack sends a visual tale highlighting the important ways its customer has used their service rather than an email with the invoice front and centre. The conversation with clients is shifting as a result of this powerful dialogue.
Uber
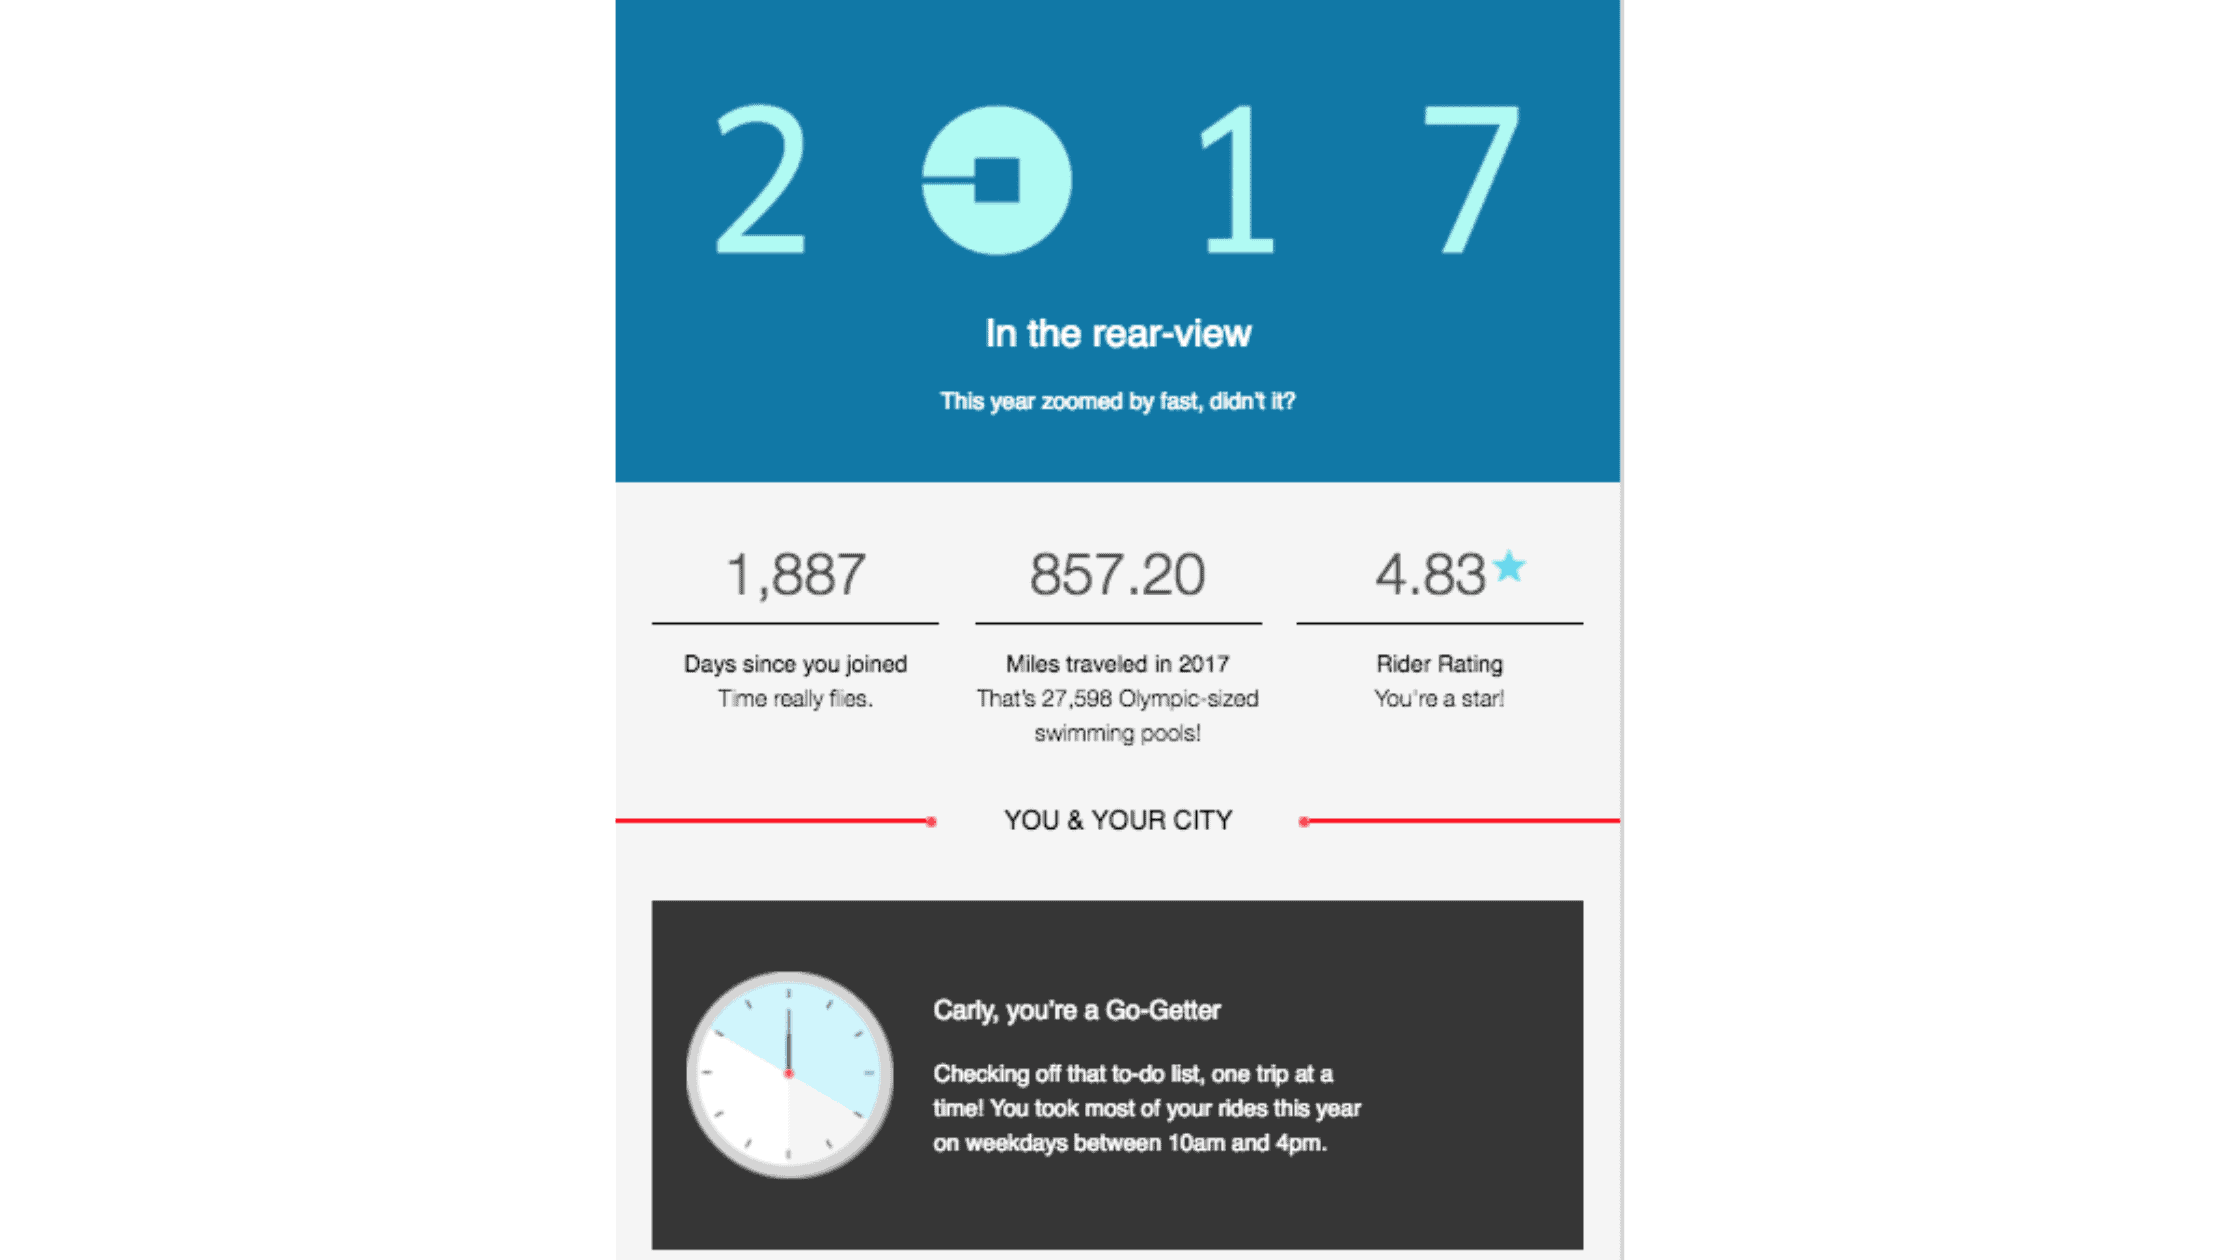
Uber, like Spotify, uses data storytelling to connect with its audience on an annual basis. Instead of sending you an annual overview email detailing how much money you have spent with Uber, they emphasise the value that the service has brought to its users. You can see right away how much of an impact they’ve had thanks to the user’s experience with the app being displayed in personalised statistics.
Why Data Storytelling Should Matter To Businesses
If businesses genuinely understand their data, they can accomplish much more with it. Businesses continue to spend money on business intelligence and analytics solutions, but they may not always be getting the data they require to make better business decisions.
As more businesses invest in establishing a data-driven culture, data storytelling is critical for clarifying tough or complex analytical concepts for decision-makers who are unfamiliar with data science concepts or processes. And very little change may happen if the data are not understood clearly.
Now, keep in mind that developing your reports into stories takes careful preparation and strategy; it doesn’t happen overnight. You may say “goodbye” to raw statistics and “hello” to reporting that is understandable, useful, and actionable by using data efficiently.
After all, the time it takes to print out traditional reports causes them to become stale. On the other hand, live data through a dashboard may keep your team, company, and employees consistently informed of their success and in touch with trends that might influence the roles and duties they have been given.
Data storytelling ultimately enables users to make quicker and more informed decisions, freeing them more time to focus on growing the business rather than sifting spreadsheets.
To get started on creating your data stories, you don’t have to jump straight into any platforms or tools. You can simply start your data analytics journey with just Microsoft Excel. Check out our highly reviewed online course – Introduction to Data Storytelling: Narratives from Data.
For more information, you can reach out to us at (65) 6720 3333 or training.aventis@gmail.com